Welcome to the PerGeos Use Case Gallery
Below you will find a collection of use cases using PerGeos Software. Based on the technology of its predecessor Avizo Software, PerGeos is a robust software platform for visualizing, processing, and analyzing 2D and 3D digital rock image data.
These use cases include scientific publications, articles, papers, posters, presentations or even videos that show how PerGeos is used to address various scientific and industrial research topics.
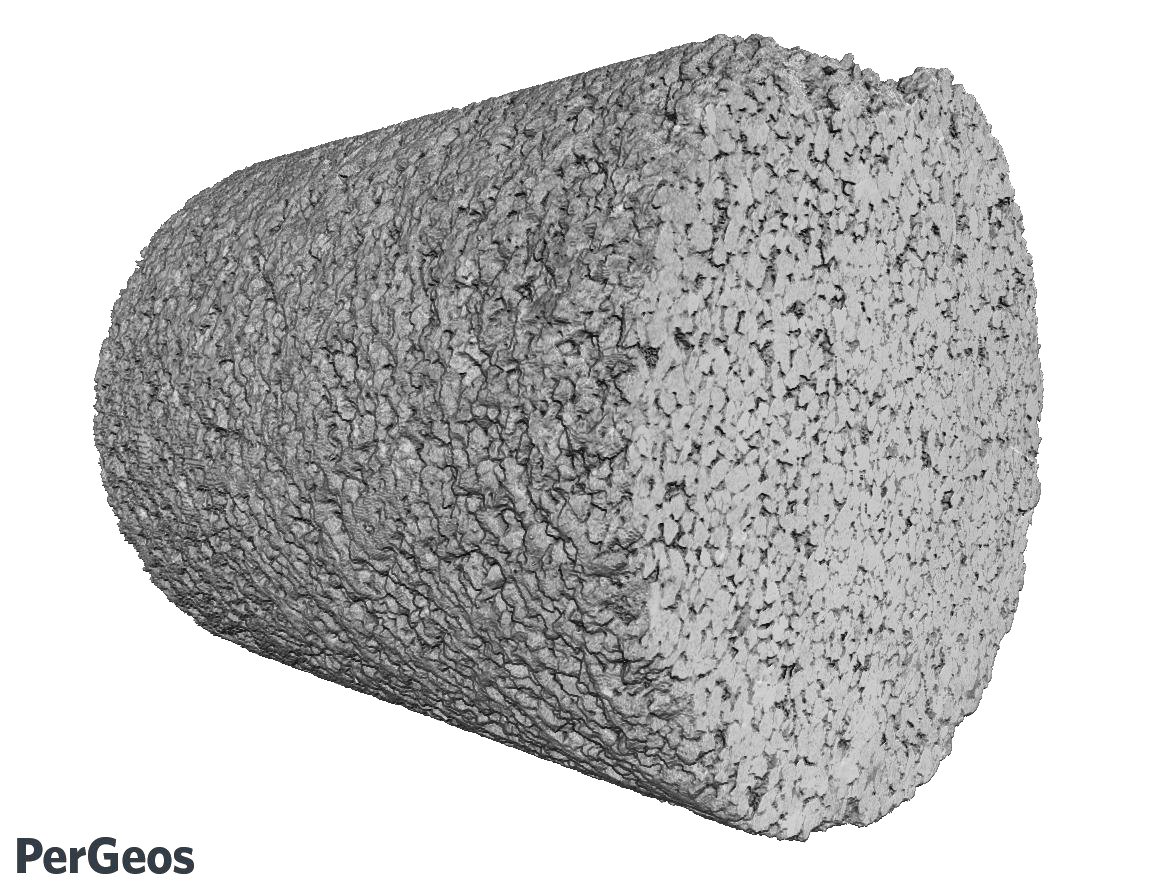
Analyzing Full Micro-CT Image of a Berea Sandstone Mini Plug and the Associated Challenges
X-ray micro-CT imaging is becoming an integral part of rock characterization processes. Large data size, user bias, and accuracy of the results are some of the challenges associated with analyzing micro-CT images of rock samples.
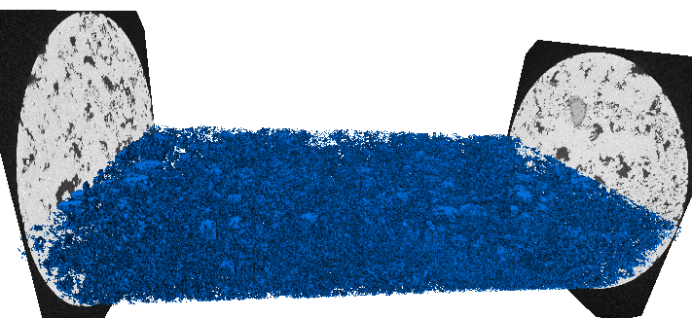
In this article, the PerGeos Digital Rock Analysis software is demonstrated to analyze the full micro-CT dataset of a Berea sandstone mini plug. The analysis is done in blocks using a PerGeos recipe (i.e. a macro) and a block-processing script. The results are... Read more
Arash Aghaei - Thermo Fisher Scientific
Handling Large data in PerGeos
We introduce here some techniques to visualize and process large data, mostly targeting the high resolution data acquired by Heliscan microCT.
The data is considered as “large” in the sense that its size exceeds the size of the GPU memory and/or the size of the RAM of the machine.
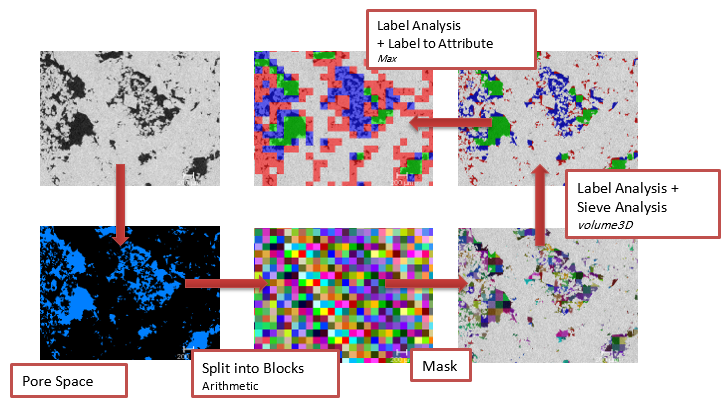
The following workflow:
- Segmentation
- Porosity / Connected porosity determination
- Pore separation / Pore Size distribution
- Grain size distribution
Gwenole Tallec - Thermo Fisher Scientific
Simple Rock Characterization in PerGeos v1.7
A key benefit to obtaining digital imagery data is the ability to use all parts of the imaged sample for characterization purposes-not just what you have time to explore manually. This is especially the case with large datasets that are created during acquisition of 2D mosaic images or Whole Core CT imagery.
In these cases, a representative area or volume of material has been obtained. The next step will be to extract features, like porosity, for analysis.
But, what else can we ... Read more
Gwenole Tallec - Thermo Fisher Scientific