Uncertainty span for relative permeability and capillary pressure by varying wettability and spatial flow directions utilizing pore scale modelling
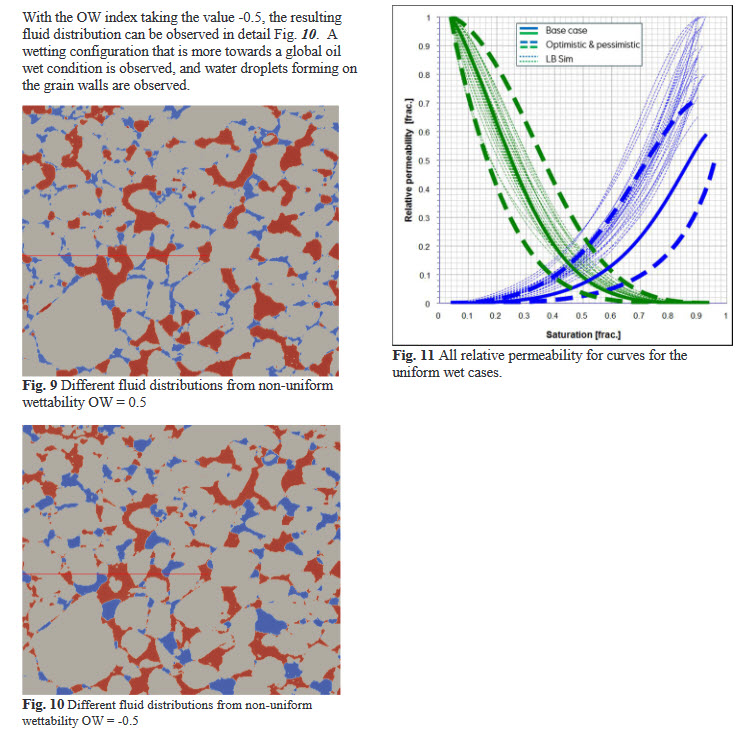
Relative permeability and capillary pressure are key properties within special core analysis and provide crucial information for full field simulation models. These properties are traditionally obtained by multi-phase flow experiments, however pore scale modelling has during the last decade shown to add significant information as well as being less time-consuming to obtain. Pore scale modelling has been performed by using the lattice-Boltzmann method directly on the digital rock models obtained by high resolution micro-CT images on end-trims available when plugs are prepared for traditional SCAL-experiments. These digital rock models map the pore-structure and are used for direct simulations of two-phase flow to relative permeability curves. Various types of wettability conditions are introduced by a wettability map that opens for local variations of wettability on the pore space at the pore level. Focus have been to distribute realistic wettabilities representative for the Norwegian Continental Shelf which is experiencing weakly-wetting conditions and no strong preference neither to water nor oil. Spanning a realistic wettability-map and enabling flow in three directions, a large amount of relative permeability curves is obtained. The resulting relative permeabilities hence estimate the uncertainty of the obtained flow properties on a spatial but specific pore structure with varying, but realistic wettabilities. The obtained relative permeability curves are compared with results obtained by traditional SCAL-analysis on similar core material from the Norwegian Continental Shelf. The results are also compared with the SCAL-model provided for full field simulations for the same field. The results from the pore scale simulations are within the uncertainty span of the SCAL models, mimic the traditional SCAL-experiments and shows that pore scale modelling can provide a time- and cost-effective tool to provide SCAL-models with uncertainties.