Study on the distribution and connectivity of organic matter pores in Longmaxi shale based on 2D and 3D FIB‐SEM
Knowledge of shale pore structure characteristics is crucial to understand gas
storage and seepage mechanisms. Organic matter (OM) pores are considered
the most important pore type in shale, and one of the currently significant
research questions focuses on the spatial distribution and connectivity of OM
pores. To answer this question, typical OM‐rich siliceous shale samples from
the Lower Silurian Longmaxi Formation were comprehensively investigated
using focused ion beam scanning electron microscopy. A three‐dimensional
model of the OM‐rich region of interest was segmented and reconstructed
based on numerous two‐dimensional slices. The types of OM were found to
control the development of organic pores, and OM pores including
honeycomb‐shaped pores, spongy‐shaped pores, and slit‐like irregular pores
are mainly formed in the pyrobitumen. The pore structure parameters of the
OM‐rich ROI revealed that the pore size distribution of honeycomb‐shaped
OM pores formed in the pyrobitumen was mainly distributed in the range of
10–50 and 80–100 nm, while the throat equivalent diameter distribution
demonstrated a unimodal curve with the main peak located at approximately
30 nm. Pore connectivity analysis further indicated that pyrobitumen also
contained several isolated nano‐pores, and pores with diameters smaller than
40 nm were poorly connected. Furthermore, permeability simulation revealed
clear discrepancies in different directions owing to the heterogeneity of the
OM pores. These findings provide experimental evidence for the assessment of
shale gas resources and their development potential.
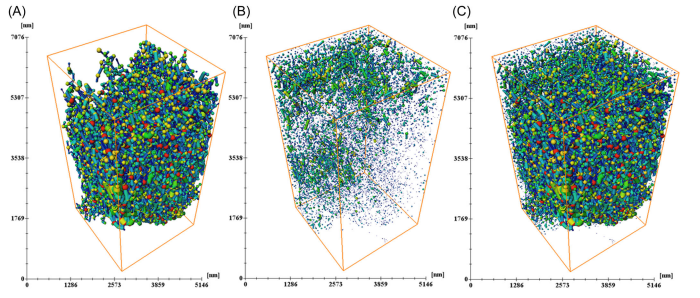
Visualization of OM PNM. (A) PNM of connected pores; (B) PNM of isolated pores; (C) PNM of total pores. OM, organic
matter; PNM, pore network model.